


Functions with two arguments can be visualized in three-dimensional plots. Getting this on paper or into a PDF, is a bit more challenging. We need a projection, a view point, or angle, there’s a depth which means parts should be hidden and others in the front.
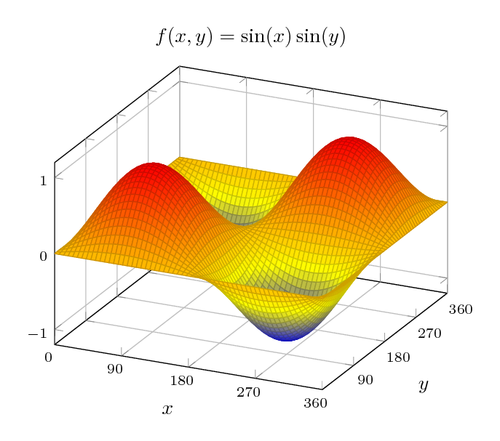
We will use the pgfplots package to plot f(x,y) = sin(x)*sin(y).
The code, and more, is explained in the LaTeX Cookbook, Chapter 10, Advanced Mathematics, Plotting in three dimensions.
% Plotting in three dimensions
% Author: Stefan Kottwitz
% https://www.packtpub.com/hardware-and-creative/latex-cookbook
\documentclass[border=10pt]{standalone}
\usepackage{pgfplots}
\begin{document}
\begin{tikzpicture}
\begin{axis} [
    title = {$f(x,y) = \sin(x)\sin(y)$},
    xtick = {0,90,...,360},
    ytick = {90,180,...,360},
    xlabel = $x$, ylabel = $y$,
    ticklabel style = {font = \scriptsize},
	grid
]
\addplot3 [surf, domain=0:360, samples=60]
	{ sin(x)*sin(y) };
\end{axis}
\end{tikzpicture}
\end{document}
Open in Overleaf: 3d-plot.tex