


Pie charts are popular for showing proportions. A pie chart’s main characteristic is that all items usually sum up to 100 percent.
We will use the pgf-pie package. Its square option gives a quadratic design. We will add the scale font and color option.
Full explanation in Chapter 9, Creating Graphics: Drawing a pie chart
% Square chart
% Author: Stefan Kottwitz
% https://www.packtpub.com/hardware-and-creative/latex-cookbook
\documentclass[border = 10pt]{standalone}
\usepackage{pgf-pie}
\begin{document}
\begin{tikzpicture}
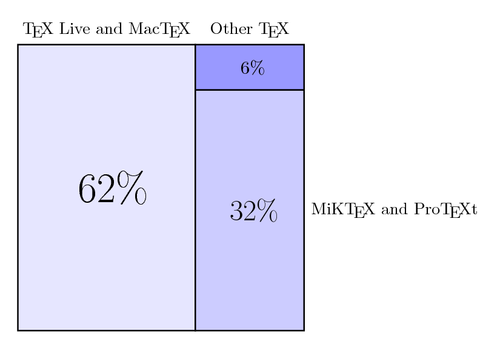
\pie [square, scale font,
color = {blue!10, blue!20, blue!40}]
{ 62/\TeX\ Live and Mac\TeX,
32/MiK\TeX\ and Pro\TeX t, 6/Other \TeX }
\end{tikzpicture}
\end{document}
Open in Overleaf: square-chart.tex