


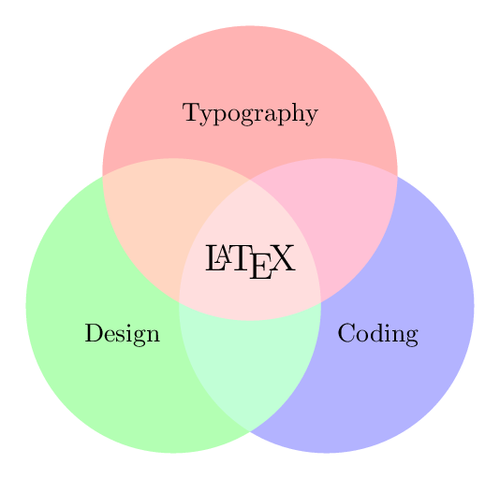
A Venn diagram displays several sets with their relationships. Commonly, these are overlapping circles. Such sets can stand for certain properties. If an element has two such properties, it would belong to an overlapping area – the intersection of the two relevant sets.
We will create three filled circles. The center of each circle is specified in polar coordinates, with a given angle and distance from the origin. This makes radial placement easier. For example, the first circle has its center at (90:1.2). This means that the center is at 90 degrees, which is above the origin, and the distance is 1.2. The radius of each circle is 2. So, they are overlapping.
Normally, overlapping would simply mean that the final circle overrides what is below it. We still wish to look behind the circles to see the intersections. A classical approach is to use transparency, here we will use the blend mode feature of the PDF standard.
Note: PDF blend mode requires TikZ version 3.0 or above.
Full explanation in Chapter 9, Creating Graphics: [Drawing a Venn diagram](http://latex-cookbook.net/articles/venn-diagram/)
% A Venn diagram with PDF blending
% Author: Stefan Kottwitz
% https://www.packtpub.com/hardware-and-creative/latex-cookbook
\documentclass[border=10pt]{standalone}
\usepackage{tikz}
\begin{document}
\begin{tikzpicture}
  \begin{scope}[blend group = soft light]
    \fill[red!30!white]   ( 90:1.2) circle (2);
    \fill[green!30!white] (210:1.2) circle (2);
    \fill[blue!30!white]  (330:1.2) circle (2);
  \end{scope}
  \node at ( 90:2)    {Typography};
  \node at ( 210:2)   {Design};
  \node at ( 330:2)   {Coding};
  \node [font=\Large] {\LaTeX};
\end{tikzpicture}
\end{document}
Open in Overleaf: venn.tex