


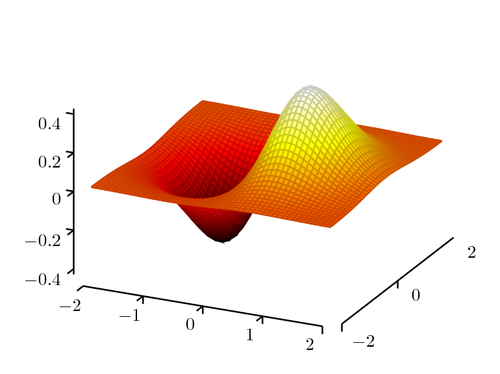
We will use pgfplots for a three-dimensional plot of an exponential function.
We will apply a style for reduced and shifted axes, to get a distraction-free visualization.
If you don’t have it already, download the file http://pgfplots.net/media/tikzlibrarypgfplots.shift.code.tex, and put it into your document folder.
Load this style in your preamble by:
\usepgfplotslibrary{shift}
Now, we can use the shift style, as in this short example.
The code, and more, is explained in the LaTeX Cookbook, Chapter 10, Advanced Mathematics, Plotting in three dimensions.
% Distraction-free plotting in three dimensions
% Author: Stefan Kottwitz
% https://www.packtpub.com/hardware-and-creative/latex-cookbook
\documentclass[border=10pt]{standalone}
\usepackage{pgfplots}
\usepgfplotslibrary{shift}
\begin{document}
\begin{tikzpicture}
  \begin{axis} [shift3d]
    \addplot3 [surf, colormap/hot2, domain = -2:2, samples = 50]
      { x/exp(x^2+y^2) };
  \end{axis}
\end{tikzpicture}
\end{document}
Open in Overleaf: 3d-reduced-plot.tex