


The standard pgfplots axis environment is used for Cartesian coordinates. However, pgfplots provides also logarithmic axes and polar axes.
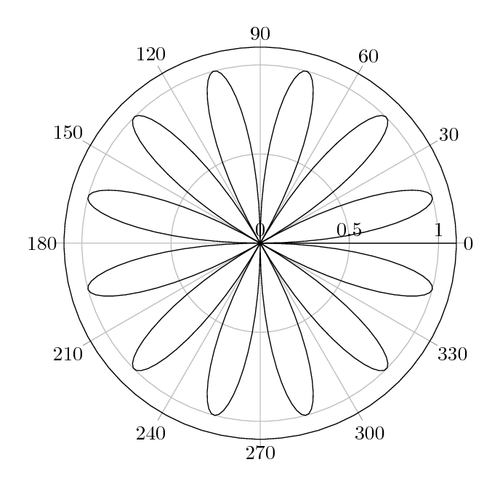
Functions can also be defined in polar coordinates. In a polar coordinate system, each point is determined by the distance from the origin 0 and by the angle to a reference axis. Now, the argument of a function is expected to be an angle, and the function value is considered as the distance from the origin.
The code, and more, is explained in the LaTeX Cookbook, Chapter 10, Advanced Mathematics, Plotting functions in two dimensions.
% Plotting in polar coordinates
% Author: Stefan Kottwitz
% https://www.packtpub.com/hardware-and-creative/latex-cookbook
\documentclass[border=10pt]{standalone}
\usepackage{pgfplots}
\usepgfplotslibrary{polar}
\begin{document}
\begin{tikzpicture}
  \begin{polaraxis}
    \addplot[domain=0:360,samples=300] {sin(6*x)};
  \end{polaraxis}
\end{tikzpicture}
\end{document}
Open in Overleaf: polar-plot.tex