


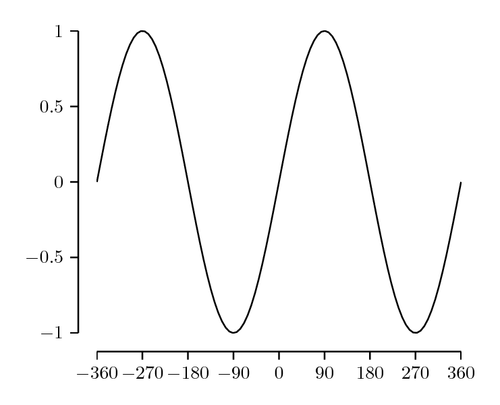
We plot a sine function with PGFplots, similar to: http://latex-cookbook.net/cookbook/examples/grid-plot/
While a grid and a lot of ticks can be useful to inspect specific values of a function, an overall view onto a function can be nicer with reduced axes, maybe even shifted away a bit.
There’s a style which you can use. If you download the file at http://pgfplots.net/media/tikzlibrarypgfplots.shift.code.tex, and put it into your document folder, you can load this style in your preamble, as written below.
Then, just change the axis option grid to shift.
The code, and more, is explained in the LaTeX Cookbook, Chapter 10, Advanced Mathematics, Plotting functions in two dimensions.
% Plotting a function with minimal axes
% Author: Stefan Kottwitz
% https://www.packtpub.com/hardware-and-creative/latex-cookbook
\documentclass[border=10pt]{standalone}
\usepackage{pgfplots}
\usepgfplotslibrary{shift}
\begin{document}
\begin{tikzpicture}
  \begin{axis} [shift, xtick = {-360,-270,...,360}]
    \addplot [domain=-360:360, samples=100, thick] { sin(x) };
  \end{axis}
\end{tikzpicture}
\end{document}
Open in Overleaf: minimal-plot.tex