


Functions play an important role in mathematics. To visualize them to better understand their properties, for seeing roots and extreme points, we can plot them in a coordinate system.
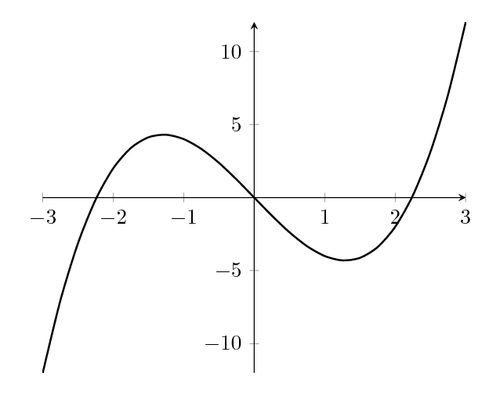
Here, we will see how to easily plot functions. We will print the polynomial function f(x) = x^3 – 5*x.
We use the pgfplots package, which bases on pgf/TikZ.
The code, and more, is explained in the LaTeX Cookbook, Chapter 10, Advanced Mathematics, Plotting functions in two dimensions.
% Plotting a function
% Author: Stefan Kottwitz
% https://www.packtpub.com/hardware-and-creative/latex-cookbook
\documentclass[border=10pt]{standalone}
\usepackage{pgfplots}
\begin{document}
\begin{tikzpicture}
  \begin{axis} [axis lines=center]
    \addplot [domain=-3:3, smooth, thick] { x^3 - 5*x };
  \end{axis}
\end{tikzpicture}
\end{document}
Open in Overleaf: function-plot.tex